
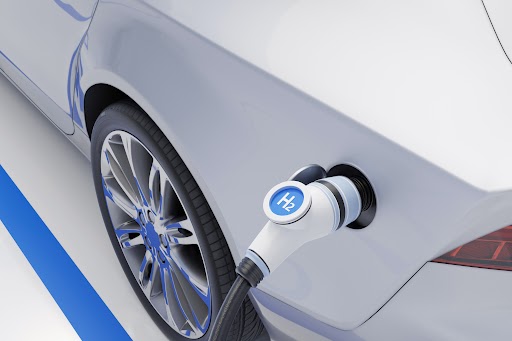
Energy use and CO2 emissions from transportation The transportation sector accounts for around 30% of global final energy consumption. Given that most of our energy is still derived from fossil fuels, despite the growing share of renewable energy generation and the announced carbon neutrality ambitions by 2050, transportation is already at the top of a list of sectors to decarbonize. What’s more, transport has the highest level of reliance on fossil fuels of any other sector. According to the International Energy Agency, road transportation alone accounts for approximately 15% of global energy-related GHG emissions. During the last few years, the public debate on reducing road transport emissions has been dominated by battery electric vehicles (BEVs), which represent a promising path towards decarbonizing the sector. However, despite significant advances in cost and economic competitiveness—EVs are already competitive with internal combustion engine (ICE) vehicles on a total cost of ownership (TCO)1 basis—a few challenges have hampered market development, most notably in terms of practicality, limited autonomy2, and long refueling times of BEVs. The Hydrogen Fuel Case The use of hydrogen as a fuel, particularly green (hydrogen produced from water electrolysis3) or blue hydrogen (produced from natural gas and supported by CCS4), could be the key to decarbonizing road transportation. This is because not only can fuel cell electric vehicles (FCEVs) already, similar to conventional ICE vehicles, refuel in less than 4 minutes and have a driving range of over 450km5 but also, just like BEVs, they produce no harmful tailpipe emissions. From a cost perspective, because the level and type of performance required vary from one vehicle segment to another, it’s important to make a distinction between light and heavy-duty vehicles. For the sake of illustration, we consider the 3 main vehicle segments: passenger cars, HDT, and off-road, and compare the FCEV options to the BEV and ICE versions by the total cost of ownership (TCO). Passenger Cars: Based on a TCO analysis by energy consultancy Element Energy, FCEVs are quite a long way from being cost competitive with electric and conventional passenger cars, especially for first-time owners. And although the TCO of FCEVs in the segment is expected to drop significantly over the next decade due to falling fuel cell costs, BEVs are expected to remain a much more attractive option in comparison, except for larger passenger cars, SUVs, and vans with longer-range requirements and heavier use cycles (e.g., for taxis and ride-sharing) where FCEVs become a reasonable alternative. Heavy-Duty Vehicles/Trucking (HDT): According to a report by the Hydrogen Council and McKinsey, on-demand HDT FCEV is expected to become the cheapest option in terms of TCO by 2030, assuming a hydrogen price at the dispenser of about $4/kg in 2030. The analysis suggests that HDT FCEV should achieve break-even with BEVs by around 2025 and with ICE HDTs by 2028, driven primarily by a drop in hydrogen fuel costs and equipment costs. It’s worth noting that, in a context where targeted subsidies such as Switzerland’s toll exemption policy or other support mechanisms exist, the described timeline could be even shorter. Off-Road Equipment/Vehicles: Due to the specific performance requirements of off-road equipment, fuel cell powertrains are potentially the only alternative to GHG-emitting equipment. In the context of achieving net zero targets, decarbonizing the off-road vehicle segment is of particular importance. That’s because mining rare earth metals is critical for green technology manufacturing (including fuel cells), and off-road equipment (such as excavators and wheel loaders) is heavily used in mining operations. Regarding the cost, the latest estimates from the US DoE and the Journal of Hydrogen suggest that fuel cells are already the lower-cost option for compact tractors/wheel loaders and standard/full excavators. Developing the hydrogen sector Hydrogen-fueled cars have been commercially available for almost a decade. Despite that, due to the lack of infrastructure, their sales remain dwarfed by those of BEVs. Mindful of the sector’s potential, governments have started over the past few years drafting strategies and creating policies in support of hydrogen, including investment incentives for the construction of hydrogen production and refueling facilities to enable the deployment of FCEVs. Below are some examples: Japan: In 2017, the Japanese government issued the Basic Hydrogen Strategy and became the first to adopt a national hydrogen framework. Through a series of legislation and plans, it aims to expand its hydrogen economy and production to 20 million tonnes by 2050. United States: At the federal level: the Emergency Economic Stabilization Act of 2008 introduced incentives in the form of tax credits to help minimize the cost of hydrogen and fuel cell projects. Since then, the tax credit policy has been extended and its scope enlarged to include refueling equipment and energy storage system facilities. A wealth of other incentives has been introduced, most notably through the Biden Administration’s Build Back Better Act. At the state level: energy authorities have taken similar steps. In 2020, the California Energy Commission (CEC) committed to investing up to $115 million to significantly increase the number of Hydrogen Refueling Stations (HRSs) in the state. California is on track to achieve its target of deploying 200 HRSs by 2025. Germany: In June 2020, Germany presented its National Hydrogen Strategy. The strategy document identified several goals that need to be achieved for green hydrogen to become an effective tool in reaching emissions neutrality by 2050, including the scale-up of H2 production and transport capacity, as well as the introduction of support schemes and public funding. Germany committed to providing public funding amounting to €7 billion for the market ramp-up of hydrogen technology in the country. Chile: In addition to their National Electromobility Strategy published in 2017, which includes goals on green hydrogen and fuel cells applications, Chile announced its National Green Hydrogen Strategy in 2020, and the goal to be carbon neutral by 2050. Figure 1: HRS by region, 2021 [caption id="attachment_8368" align="aligncenter" width="486"] source: IEA, 2022[/caption] On the private sector front, energy companies are already competing for market shares of Hydrogen Refueling Stations (HRSs). Today, the fast-growing HRS market is dominated by a few Oil & Gas and hydrogen companies, namely Air Products, Linde, Air Liquid, and Nel. To enter the market, some companies chose to combine their investment efforts through JVs, such as the German H2 Mobility JV, which operates a global network of 200+ HRS. Concerning car manufacturing, major OEMs are offering a limited but growing number of FCEVs to the public in certain markets, in line with what the developing infrastructure can support. It is estimated that around 52 thousand FCEVs are currently in circulation, with the majority of them concentrated in the United States (38%) and Korea (24%). Figure 2: FCEVs by region, 2021 [caption id="attachment_8369" align="aligncenter" width="458"] source: IEA, 2022[/caption] The net zero emissions by 2050 scenario requires transport sector emissions to fall by 20% by 2030. To achieve this goal, new sales of PHEVs, BEVs, and FCEVs need to represent 64% and 30% of total passenger car sales and HDT sales, respectively, by 2030. The TCO data summarized in this article shows that, rather than competing against BEVs, hydrogen-fueled vehicles can help achieve this objective by taking up the baton where BEV technology fails to deliver, in particular in the HDT segment. Notes: 1: The total cost of ownership includes both purchase cost and running cost, i.e., fuel and maintenance costs, over the lifetime of the vehicle. 2: Based on EPA data, the median range for 2021 model EVs was 234 miles (source) 3: Water electrolysis uses an electrical current to separate the hydrogen from the oxygen in water. If this electricity is obtained from renewable sources, hydrogen will therefore be produced without emitting carbon dioxide into the atmosphere. 4: CCS stands for Carbon Capture and Storage. In the case of blue hydrogen production, the CO2 generated during the manufacturing process is captured and stored permanently underground. The result is low-carbon hydrogen that produces no CO2 5: 300 miles based on US DoE estimates –converted to km and rounded for the sake of convenience (Source) Oussama El Baz Sources: IEA, Key World Energy Statistics 2021 IEA, World Energy Outlook, 2021 IRENA, Green hydrogen cost reduction, 2020 IEA, Global EV Outlook 2022 US DoE Alternative Fuels Data Center European Parliament – What if hydrogen could help decarbonize transport? European Commission, Biofuels in the European Union, A vision for 2030 and beyond Element Limited, Electric Cars: Calculating the Total Cost of Ownership for Consumers, 2021 US Department of Energy, Hydrogen and Fuel Cell Technologies Office, 2022 Hydrogen Council, A perspective on hydrogen investment, market development and cost competitiveness, 2021 Cleantech Group, Decarbonizing off-road vehicles, 2022 US DoE, Hydrogen Fuel Cell Technologies Office, 2022 Journal of Hydrogen, Performance, and cost of fuel cells for off-road heavy-duty vehicles, 2022 International Partnership for Hydrogen and Fuel Cells in the Economy Marca Chile, Electromobility: Chile is leading the way in Latin America with ambitious goals, 2021 Watson Farley & Williams, The German Hydrogen Strategy, 2021 Baker McKenzie, How Proposed New US Hydrogen Tax Incentives Should Spur Investment, 2021 US DOE, Financial Incentives for Hydrogen and Fuel Cell Projects JD Supra, Clean Energy Tax Proposals in Biden’s New “Build Back Better” Framework, 2021 California Energy Commission, 2020 Exxon Mobil – What is blue Hydrogen Iberdrola – Green hydrogen: an alternative that reduces emissions and cares for our planet

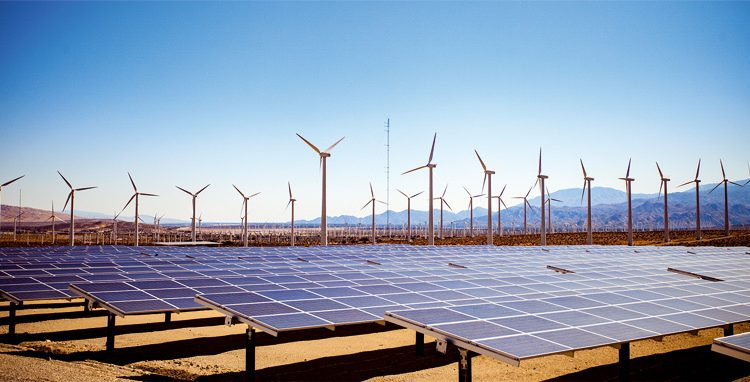
The world is currently shifting its energy system away from hydrocarbons and towards low-carbon energy sources, with a view to eventually transitioning to a net-zero energy system. As a result, governments and energy companies alike are placing large wagers on hydrogen, in an effort to lower emissions. The GCC countries have long been concerned about the sustainability of their hydrocarbon revenues and have taken early steps to develop national hydrogen strategies. Saudi Arabia and the United Arab Emirates lead the way in this regard and have positioned themselves to become major hydrogen exporters. Japan, China, and South Korea, on the other hand, currently some of the top destinations for Saudi and Emirati crude oil, are set to emerge as major importers of hydrogen. The recent export by the Emirates’ state-owned oil company ADNOC, of its first blue hydrogen cargo to Japan, marks the first step toward solidifying this emerging relationship. Hydrogen Steadily Gaining Ground in the GCC The UAE joined the Global Hydrogen Council in July 2021, and developed its National Clean Energy Strategy 2050, under which ADNOC will produce 300,000 metric tonnes of hydrogen annually. In Saudi Arabia, a green hydrogen project is scheduled for completion by 2025, with a capacity of 650 metric tonnes of hydrogen, and 1.2 million tonnes of green ammonia, making it one of the largest such projects in the world. In Kuwait, meanwhile, the National Petroleum Company (KNPC) has completed work on a hydrocracker unit at a cost of $16 billion, that can produce 454,000 tonnes of clean fuel. Oman Oil Company, for its part, is implementing a project to produce 1.8 million tonnes of green hydrogen at a cost of $30 billion, using solar and wind energy. Factors favoring the production of Blue Hydrogen* in the GCC (*Hydrogen produced using carbon capture and storage technology to store the CO2 created as a byproduct of the process) The GCC is one of the largest and lowest-cost producers of natural gas globally, accounting for 20% of the world’s gas reserves. Qatar is the third-largest worldwide, with 24.7 trillion cubic meters (TCM) of proven natural gas reserves, while Saudi Arabia (6 TCM) and the UAE (5.9 TCM) hold the ninth and tenth spots, respectively. The availability of existing facilities in the GCC involved in the production of ammonia, fertilizers, methanol, steel, and hydrogen. These facilities are often already concentrated in clusters along with power and desalination plants, making ideal centers to expand the use of the carbon capture, use, and storage (CCUS) needed to create blue hydrogen. Examples include the facilities of SABIC in Saudi Arabia, FERTIL in the UAE, QAFCO in Qatar, PIC16 in Kuwait, OMIFCO in Oman, and Bahrain’s SULB. GCC hydrocarbon producers have significant CO2 storage capacity. Carbon capture, utilization, and storage (CCUS) enable the production of low-carbon hydrogen, and the voided spaces in oil and gas fields alone, within the GCC, accounting for a storage capacity of 33.4 GtCO2e, allowing for ample reservoirs for hydrogen producers. GCC producers have well-developed existing infrastructure, such as their natural gas grids, which could be modified for transporting hydrogen inland for domestic purposes. Factors favoring the production of Green Hydrogen* in the GCC: (*Hydrogen produced using electricity generated from renewables, such as wind or solar) The GCC is a high-potential region for renewables benefitting from some of the highest solar radiation levels in the world, as well as strong and regular winds in some areas. This makes the GCC region potentially one of the most cost-competitive for hydrogen production, with long-term costs potentially reaching USD 1.5 - 2 per kg, compared to USD 3.0 - 4+ per kg in Europe and parts of Asia. GCC countries enjoy sufficient funding availability for investment in hydrogen, having created significant financial reserves from their oil & gas economies. These reserves allow them to cover the cost of producing green hydrogen, which is high compared to that of producing blue hydrogen. The GCC already has a highly qualified workforce in the oil & gas sector. This represents a major opportunity for the development of the hydrogen economy in the region, due to the high transferability of their skills. GCC countries have advanced export infrastructure. The UAE’s Jebel Ali and Saudi Arabia's Jeddah ports, for instance, were among the top 40 ports in the world in 2019, according to the World Shipping Council. GCC countries are centrally located relative to energy demand markets, situated as they are between the potentially large European and East Asian markets. Potential Hydrogen Imports from High Demand Regions EU hydrogen imports from the GCC could reach 100 mMT by 2050, according to a recent report published by Dii & Roland Berger. In East Asia, meanwhile, imports from the GCC could reach approximately 85 mMT of ammonia by the same year, leaving GCC countries in a prime position to become major players in the hydrogen industry. Source: Vision Port of Rotterdam, Germany's National Hydrogen Strategy, EU Hydrogen Strategy, METI, Hydrogen Korea Team, Roland Berger, Dii Desert Energy. Potential Revenues from Hydrogen Exports Global hydrogen demand is expected to reach approximately 580 mMT by 2050. All indicators point to the potential for the GCC to replace its position as a global oil giant, with that of a global hydrogen hub, with potential green hydrogen revenues alone expected to reach USD 70-200 billion by 2050. Looking Forward The GCC is in an excellent position to become a leading green and blue hydrogen producer, which would allow the region to occupy an important place in the nascent hydrogen industry. By seizing this opportunity, GCC countries can ensure their continued prominence in the global energy market, all the while moving towards a decarbonized world. Author: Dina Amer References: MEI@75, Warming to a Multi-Colored Hydrogen Future? The GCC and Asia Pacific, 2021 https://www.mei.edu/publications/warming-multi-colored-hydrogen-future-gcc-and-asia-pacific Gulf News, Gulf economies are ready to take on clean energy and hydrogen projects, 2021 https://gulfnews.com/business/analysis/gulf-economies-are-ready-to-take-on-clean-energy-and-hydrogen-projects-1.1628060444446 Qamar Energy, Hydrogen in the GCC, a report for the regional business development team Gulf Region, 2020 https://www.rvo.nl/sites/default/files/2020/12/Hydrogen%20in%20the%20GCC.pdf Dii Desert Energy & Roland Berger, The Potential for Green Hydrogen in the GCC region, 2021 https://www.menaenergymeet.com/wp-content/uploads/the-potential-for-green-hydrogen-in-the-gcc-region.pdf Brookings, Economic diversification in the Gulf: Time to redouble efforts, 2021 https://www.brookings.edu/research/economic-diversification-in-the-gulf-time-to-redouble-efforts/ The IEA, The Future of Hydrogen; Seizing today’s opportunities, 2019 https://www.iea.org/reports/the-future-of-hydrogen The IEA, The Role of CO2 Storage, 2019 https://www.iea.org/reports/the-role-of-co2-storage KAPSARC, Opportunities for Natural Gas Trade and Infrastructure in the GCC, 2020 https://www.kapsarc.org/research/publications/opportunities-for-natural-gas-trade-and-infrastructure-in-the-gcc/

Expo 2020 Dubai, the region's first of its kind, has been a long-awaited event. With its “Connecting Minds, Creating the Future” theme, Expo 2020 is focusing on three main elements: sustainability, mobility, and opportunity. Aiming to become the most sustainable expo so far, Expo 2020 Dubai has taken diverse measures from installing renewable energy systems to reducing water usage and segregating waste. Expo 2020’s sustainability efforts are supported by its partners that have been undertaking various sustainability initiatives of their own besides helping realize the expo's sustainability vision. Expo 2020 partners and environmental sustainability efforts GHG emissions Expo 2020 partners are taking climate action by setting ambitious GHG emissions reduction goals. For example, Accenture is targeting net-zero carbon emissions by 2025, with specific goals to reduce absolute GHG emissions by 11% and its scope 1&2 emissions by 65% from its 2016 baseline. Cisco has also promised to have net-zero emissions by 2040, with near-term goals of reaching net-zero for global scope 1&2 emissions by 2025 and reducing scope 3 emissions by 30% by 2030 from its 2019 baseline. Water consumption Expo 2020 partners are also working on reducing their water consumption. For example, PepsiCo has reduced its consumption by 21% from 2018 to 2020. The company has also pledged to improve its water use efficiency by 15% in agriculture, and by 25% in operations from its 2015 baseline. It is also hoping to replenish the water consumed in manufacturing by 100%. Renewable energy Expo 2020 partners are conscious of the impact of their operations on the environment and thus have been switching to clean energy sources. For instance, both SAP and Mastercard are fully relying on renewable energy, with 100% of their electricity being generated from renewables in 2020. Waste recycling Waste recycling initiatives are also key for the Expo 2020 partners. Among the partners, Nissan is a leader, with 96% of its wastes either recycled or diverted in 2020. It is followed by Siemens, with 93% of its wastes recycled or diverted in the same year. Some partners have set other waste recycling goals such as Accenture, which pledged to repurpose or recycle 100% of its e-waste by 2025. Partners’ contribution to a more sustainable Expo 2020 Siemens As the Expo 2020 Infrastructure Digitalization Partner, Siemens is helping the expo achieve its sustainability targets by integrating its smart building technology across the expo structures, providing transparency into their energy and water consumption. PepsiCo In preparation for the event, PepsiCo has launched Expo 2020 Dubai co-branded Aquafina cans and glass bottles, as well as limited-edition Pepsi cans, which are all fully recyclable. PepsiCo is also collaborating closely with Dulsco, the official waste management partner for Expo 2020, to ensure waste is collected and recycled, supporting the Expo’s waste diversion targets. Mastercard Mastercard, Expo 2020's official payment technology partner, has created an add-on feature to Expo 2020 tickets, which allows visitors to donate to Mastercard's Priceless Planet Coalition. Expo 2020 highlights the urgent need to embrace sustainability, which can be observed through the efforts made by the organizers and partners to change their practices to create a more sustainable future. Partner companies have come a long way to achieving their goals in terms of reducing greenhouse emissions, curbing their water consumption, using renewable energies, and recycling their waste. Some had more noticeable successes than others, such as SAP, Accenture, and Cisco, while others are still on the way. Expo 2020 partners, including Siemens, Emirates, PepsiCo, MasterCard, and DP World have also contributed to a more sustainable expo, emphasizing the significance of sustainability to all Expo visitors. Khawla Khrifi - Business Research Analyst Sources: Expo 2020 and Environmental Sustainability
"Power to X" in few words "Power to X" or "PtX" is a technology that consists in transforming electricity into another energy vector. This "X-vector" could be heat (Power to Heat) to meet industrial needs or to supply heating networks. It could also be a synthesis gas (Power to Gas) such as hydrogen for mobility purposes, or methane which can itself be injected into the gas network for industrial, heating, or mobility needs. "Power to X": What opportunities exist for Morocco? Thanks to its strategic geographical position and exceptional wind and solar energy potential, Morocco could capture a significant share of Power to X demand, estimated at 2- 4% of global demand in 2030. This was the most prominent result of the two studies carried out simultaneously by the three German Fraunhofer Institutes in 2018 that aim to explore the economic and ecological impact of Power to X on Morocco. In this regard, a workshop about Power to X technology and its opportunities in Morocco was organized on February 11, 2019 within the framework of the Moroccan-German Energy Partnership (PAREMA). The purpose of the workshop was to showcase the results of these studies that reveal to which extent this technology will constitute an opportunity for renewable energy in Morocco as a local industry with high export potential given the country's objective of reaching 52% of the renewable energy mix by 2030. However, according to Prof. Wolfgang Eichhammer project coordinator from Fraunhofer ISI, investing in technologies substituting fossil energy sources but involving other environmental risks such as increasing the consumption of land, water and resources have to be assessed very carefully and linked to sustainability criteria. In this respect, Morocco could become an exporter of carbon-neutral energy sources and make a major contribution to achieving the Paris Climate Agreement target if and only if it is able to deal with the risks associated with PtX. To this end, the Minister of Energy, Mines and Sustainable Development announced the establishment of a national task force supported by a consortium of public and private actors as well as the elaboration of an in-depth study to prepare the PtX roadmap for Morocco. Hydrogen & Ammonia: main development focus by 2030 The Research Institute for Solar Energy and Renewable Energies (IRESEN) has announced recently that Morocco will become a carbon-neutral energy exporter by 2030 through the launch of construction works for a dedicated platform for green hydrogen and ammonia starting January 2020. This infrastructure, with an investment amounting MAD 150 million, results from a partnership between IRESEN, via Green Energy Park, and both OCP and the Mohammed VI Polytechnic University on the Moroccan side, as well as Fraunhofer institutes on the German side. The platform will be dedicated to the R&D demonstration of Power to X technologies, with a diversified research program on hydrogen applications in the production of high added value green molecules such as ammonia and methanol. It is worth pointing out that this technology is complementary to renewable energies and will help to reduce carbon emissions while creating a strong opportunity for economic and social development through exports due to the current lack of profitability of conventional electricity exports given the sharp drop in renewable energy costs compared to electricity transmission. In addition, beyond the existing infrastructures, in particular, the Maghreb-Europe Gas Pipeline and the port infrastructure, capable of playing the role of a liquid fuel export platform, economic relationship with the European Union are constantly strengthening. In Europe, Germany which is the Kingdom's privileged partner in renewable energy sector, intends to replace its fossil fuel (coal) and nuclear energy needs starting from 2022 until 2038 by importing clean energy, in accordance with its environmental commitments. According to Badr IKKEN the General Director of IRESEN, this situation represents an important opportunity for countries like Morocco, capable of producing clean fuels, particularly green molecules such as hydrogen and green derivatives. Fertilizer industry: a good illustration of the economic opportunity for Morocco Together with hydrogen, green ammonia represents a promising economic opportunity to satisfy not only the needs of its local fertilizer industry but also those of the international market in the long term. Indeed, the Kingdom is highly dependent on imported ammonia as an input for phosphorus-based fertilizers from Ukraine, Trinidad & Tobago, and the USA. Replacing these imports with green ammonia may, therefore, strengthen local fertilizer manufacture. In terms of capacity, about 3 GW will be needed to produce 1 Mt of green ammonia, which corresponds to Morocco's current imports. A domestic production of ammonia would represent, for Morocco, not only an opportunity for independence but also an opportunity to diversify its traditional markets. Furthermore, the export of clean ammonia can reduce greenhouse emissions by ~95% making it beneficial for both exporting and importing countries. National task force to present a study on the development of PtX roadmap In April 2020, a study on the development of the roadmap was presented at the 3rd meeting of the National Power-to-x task force. According to the study, the draft roadmap should propose: - Short-term actions that aim to reduce costs along the entire production and operating value chain through the establishment of a dedicated industrial cluster to deal with the development of an infrastructure master plan. The actions also aim to ensure technology transfer through capacity building and the development of local content and to create the right conditions for the export of P2X products. - Medium-term actions through the development of a storage plan for the electricity sector and the establishment of an appropriate regulatory framework for the use of Power-to-x in transport. - Long-term actions through the development of a regulatory and commercial framework to extend Power-to-x technologies to heat production. It was also recommended that three working groups be set up. The first should be tasked with translating the roadmap into a portfolio of concrete, pilot and deployment projects for Power-to-x technologies. The second group will be responsible for developing an appropriate approach to develop exports of green molecules, in order to seize the opportunities offered in Morocco and which are already reflected in the interest expressed by the Kingdom's European partners. While the third group will be responsible for further strengthening research and development in the various fields related to Power-to-x. World "Power to X" Summit 2020: a showcase of the Moroccan leadership Organized by IRESEN, the first edition of the World Power-to-X Summit is a conference gathering policymakers, industry leaders, research experts, and worldwide innovators to discuss the PtX technology and its uses in producing renewable electricity, green molecules and feedstock, CO2 recycling.... This two-day conference was planned to take place in Marrakech from June 10 to June 12, 2020, however, with the current circumstances due to the COVID-19 pandemic, a rescheduling might take place. Safae Laghmari - Senior Analyst at Infomineo References: Ait Almouh, H. (2019). "Power To X: Quel intérêt pour le Maroc?", lavieeco.com, March 12, available at: https://www.lavieeco.com/economie/energie/power-to-x-pour-le-maroc-quel-interet-pour-le-maroc/ Benmalek, S. (2019). " Énergies propres : le modèle marocain intéresse l’Allemagne, selon Rabbah", lematin.ma, December 10, available at: https://lematin.ma/journal/2019/energies-propres-mode-marocain-interesse-lallemagne-selon-rabbah/327813.html Bladi.net (2019). "Énergies Renouvelables : les ambitions du Maroc à l’horizon 2030", bladi.net, December 2, available at: https://www.bladi.net/energies-renouvelables-maroc,62055.html Challenge.ma (2019). " Le Maroc bientôt exportateur de pétrole… vert", challenge.ma, November 30, available at: https://www.challenge.ma/petrole-vert-le-maroc-bientot-exportateur-124529/ Fédération de l'Energie (2020). "World Power to X summit 2020 du 10 au 12 Juin à Marrakech", fedenerg.ma, available at: http://www.fedenerg.ma/evenement/world-power-to-x-summit-2020-du-10-au-12-juin-a-marrakech/ Finances News Hebdo (2019). "Les grandes ambitions du Maroc sur le marché de l’hydrogène à l’horizon 2030", fnh.ma, December 9, available at: https://fnh.ma/article/developpement-durable/les-grandes-ambitions-du-maroc-sur-le-marche-de-l-hydrogene-a-l-horizon-2030 Fraunhofer - ISI, (2019). "Carbon-neutral energy from power-to-X: Economic opportunity and ecological limitations for Morocco", isi.fraunhofer.de, September 2019, available at: https://www.isi.fraunhofer.de/en/presse/2019/presseinfo-24-klimaneutrale-energie-aus-power-to-x-marokko.html H2 Today (2019). "Le Maroc veut se lancer aussi dans l’hydrogène", hydrogentoday.info, August 27, available at: https://hydrogentoday.info/news/5678 IRESEN (2019). "Terms of reference: Expert Mission for Assistance in a Study on 2050 Power-To-X Roadmap for Morocco", iresen.org, October 8, available at: http://www.iresen.org/Site_Iresen/wp-content/uploads/2019/10/ToR_ConsultMar_PtX-Road-Map-2050-Morocco_FV.pdf La Quotidienne (2019). "Le Maroc se met à la technologie «Power-to-X»", laquotidienne.ma, February 13, available at: https://www.laquotidienne.ma/article/developpement_durable%20/le-maroc-se-met-a-la-technologie-power-to-x Libération (2019). "Le Maroc pourrait devenir un exportateur de pétrole vert avant 2030", libe.ma, December 3, available at: https://www.libe.ma/Le-Maroc-pourrait-devenir-un-exportateur-de-petrole-vert-avant-2030_a113744.html MAP Ecology (2019). "«Power-to-X»: une commission nationale verra le jour", mapecology.ma, February 13, available at: http://mapecology.ma/actualites/power-to-x/ Media 24 (2019). "Energies renouvelables: le Maroc prépare sa feuille de route "Power to X", media24.com, February 13, available at: https://www.medias24.com/power-to-x-maroc-energie-145.html Media 24 (2019). "Le Maroc, exportateur de pétrole vert avant 2030", media24.com, November 30, available at: https://www.medias24.com/le-maroc-exportateur-de-petrole-vert-avant-2030-5925.html Ministry of Energy, Mines and Environment (2019). "« Power to X», Hydrogène et ammoniac verts: Quelles opportunités et priorités pour le Maroc?", mem.gov.ma, February 11, available at: https://www.mem.gov.ma/Pages/CommuniquesDePresse.aspx?CommnuniqueDePresse-89.aspx Morocco Travel Blog (2020). "World Power-to-X Summit 2020 Comes To Marrakech", moroccotravelblog.com, January 7, available at: https://moroccotravelblog.com/scalia_news/world-power-to-x-summit-2020-comes-to-marrakech/ www.energypartnership.ma (The Moroccan-German Energy Partnership - PAREMA website) https://industries.ma/la-feuille-de-route-nationale-pour-les-technologies-ptx-au-centre-dune-reunion-a-rabat/ https://leseco.ma/power-to-x-une-feuille-de-route-nationale-en-reflexion/
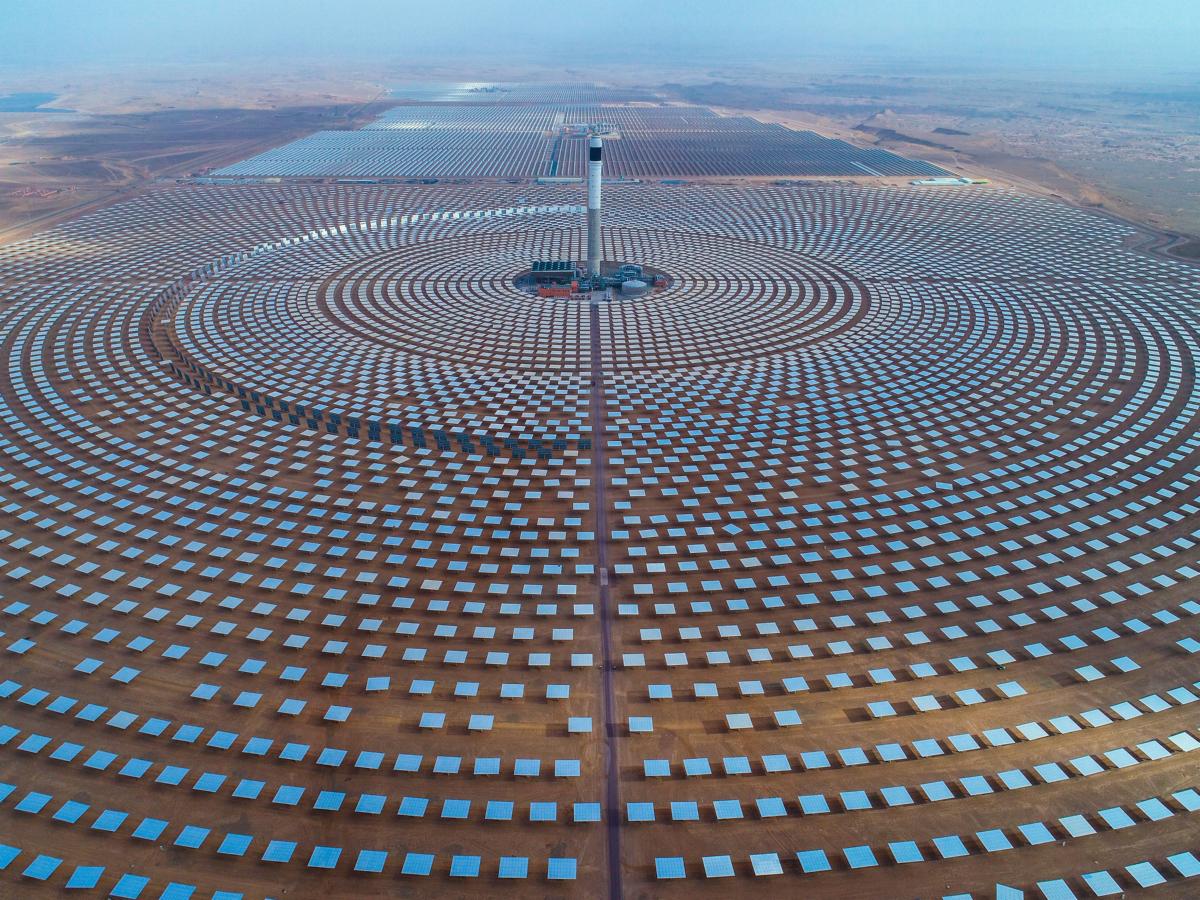
In southern Morocco, on the edge of the Saharan desert, sits one of the world’s most remarkable engineering projects: the Noor Power Plant. This is the second largest solar plant in the world with a total capacity of 510MW and an area that dwarfs the nearby city of Ouarzazate. However, its staggering size is not the only thing setting this power plant apart. Unlike most solar projects which use photovoltaic (PV) technology, the Noor Power Plant employs Concentrated Solar Power (CSP). While PV exploits the chemical and physical properties of photons hitting a solar cell (see photovoltaic effect), CSP exploits the thermodynamic properties of the sun. In simplified terms, a CSP plant has mirrors concentrating sunlight on a thermal receiver (normally molten salts) heating it up to 150–350 °C. The heat trapped in this fluid is then used to generate steam to drive a turbine connected to a generator, much like any other thermoelectric plant. This process is fundamentally different from a PV installation where the solar panel itself is the generating element. This difference has a crucial impact on the point of dispatchability. Without investing in additional battery storage assets, a PV facility can only dispatch electricity as it’s being produced. This is a huge drawback since it means that a PV system must usually be integrated by an alternative source of dispatchable energy to cover non-productive hours (nighttime, cloudy weather, etc…) or invest in expensive storage solutions (usually l-ion batteries). R&D has made strides in electricity storage techniques, but these remain a costly solution for utility scale projects. [caption id="attachment_4983" align="aligncenter" width="577"] Solar Power Explained[/caption] Instead, a CSP system can intrinsically store potential energy as heat in the working fluid for hours allowing producers to choose the time and amount of energy to dispatch even when the sun isn’t shining. This means that it does not need to be integrated by other power sources and does not require expensive electricity storage solutions. The storage capabilities have been rapidly improving just over the past few years too. Taking the Noor Power Plant as an example, Phase 1 (commissioned in 2016 ) has a storage capacity of 3 hours while Phase 2 and 3, which came online only 2 years later, can store energy for 7 hours. Despite this significant advantage CSP only accounts for less than 2% of all solar power projects. Why is this? The main factor has to do with space. CSP requires approximately twice as much acreage as PV to produce the same energy. In addition this area must be contiguous since the mirrors must reflect on a single heat receiver. Adding to this direct cost are the costs associated with construction in vast, barren, flat and hot places, i.e. deserts. Projects in these remote locations require construction of ancillary infrastructure such as longer roads, transmission lines, facilities, and transportation. This translates in higher capital expenditures for CSP. While the space requirement and associated costs are intrinsic to the technology, another cost factor are the installation costs which are still significantly higher than PV due to the relatively low developer experience and limited supply chain. Yet, these are already declining due to the slow but constant commissioning of new projects. In fact, 2018 saw a 26% drop in the global weighted average Levelized Cost of Electricity (LCOE) over 2017. CSP’s LCOE in 2018 was 0.185 USD/kWh, significantly higher than PV’s 0.085 USD/kWh. This is also still above the fossil fuel cost range (0.05-0.17 USD/kWh). Notwithstanding, current auction and PPA data suggests that by 2020 CSP will offer electricity in the USD 0.06 to US 0.10/kWh range. Dropping costs and dispatchability are bound to significantly accelerate the adoption of this technology worldwide. However, it may be wrong to view CSP and PV as competitors. As illustrated earlier, these are two fundamentally different technologies. It is the opinion of this analyst that CSP is better tailored for large utility scale projects while PV is better suited for distributed energy production and smaller capacities (rooftops, parking lots, self-consumption, etc…). CSP may be better understood as a direct competitor of other dispatchable thermoelectric energy producers such as gas and coal plants. Afterall renewable technologies should supplant fossil fuels not each other. This certainly appears to be the idea of the Moroccan Renewable Energy Agency (MASEN) which aims to blow the historical achievements set by the Noor plant out of the water with the Midelt project which integrates CSP and PV to produce 800MW in order to meet its 2020 target of 2000MW solar capacity. Over 2,000 years have passed since Archimedes used sun-mirrors to burn Roman ships to break the siege of Syracuse, it appears that we may have to rely on the same idea to get ourselves out of an even bigger mess yet again. Lorenzo W. Bruscagli - Associate at Infomineo References: RE PROJECTS MAP PV or Concentrated Solar Power, which solar power technology will you choose?, HelioSCP, August 8 2017 Renewable Power Generation Costs in 2018, IRENA MASEN Launches Noor Midelt II Solar Farm Tender Process, Morocco World News, July 10 2019
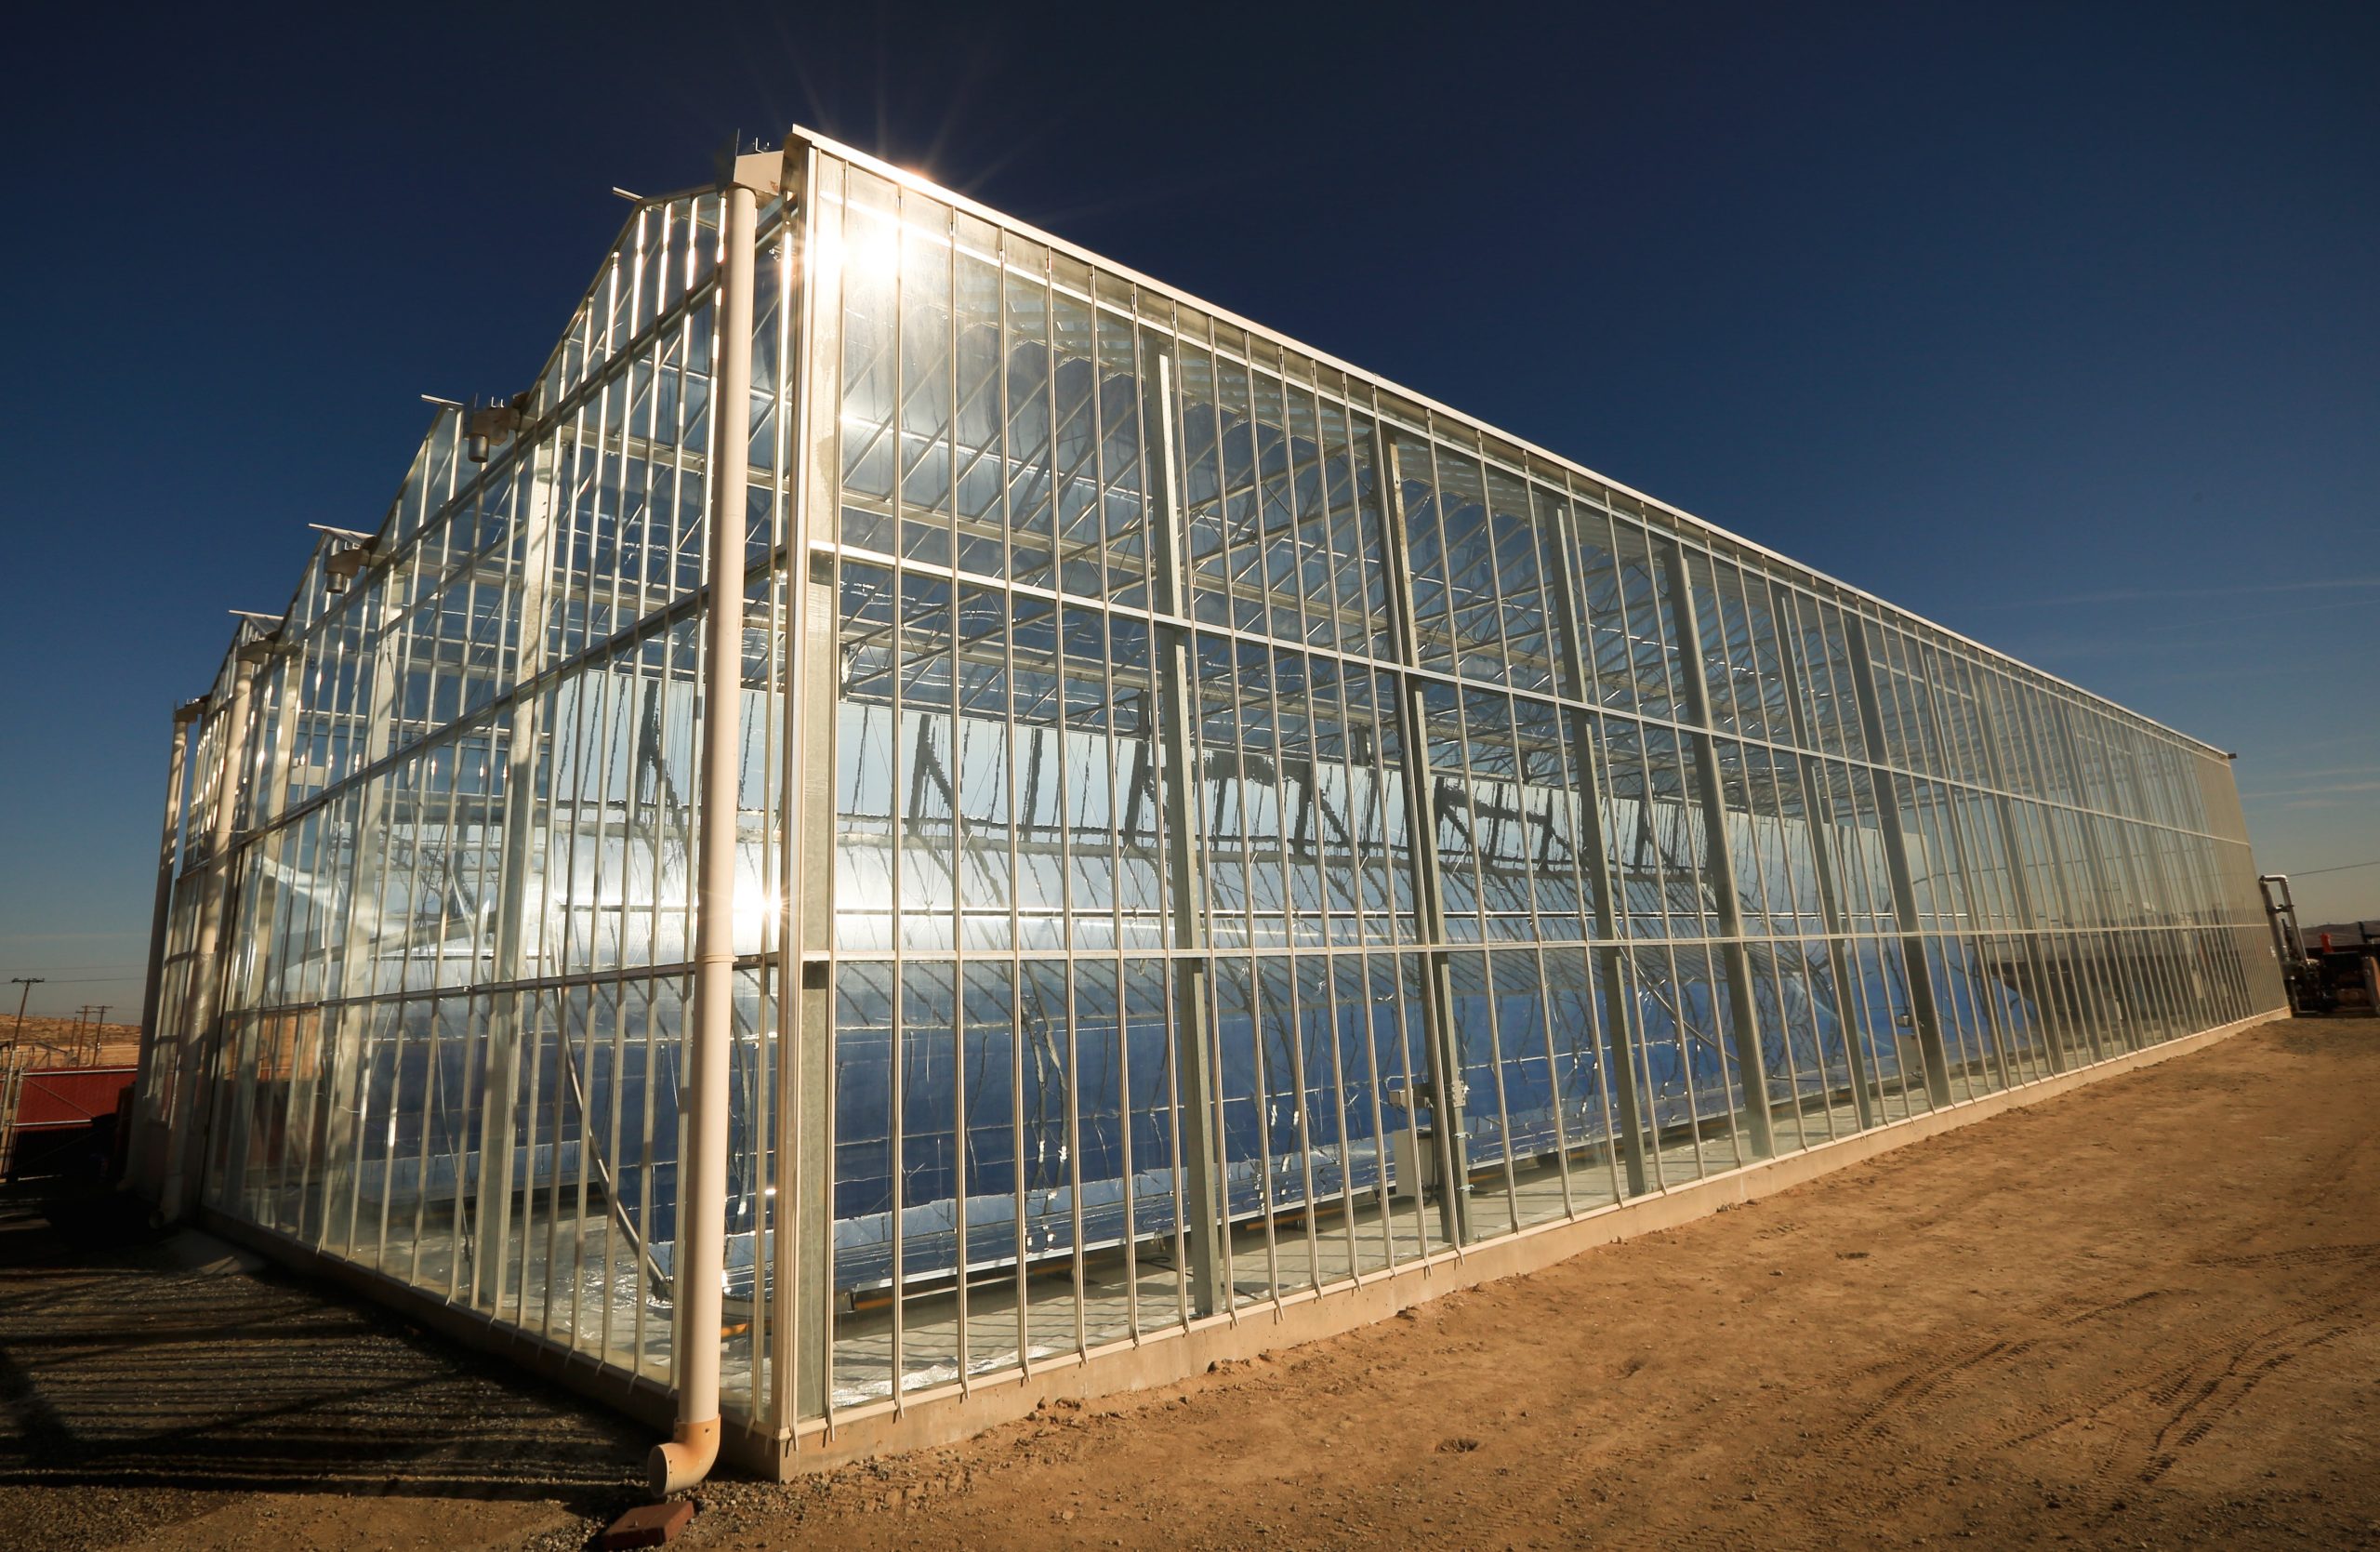
Experiences from Oman’s Miraah power plant Over the last decade, due to its maturing oil fields and limited reserves, Oman's domestic crude oil production relied heavily on Enhanced Oil Recovery (EOR) methods. Just as in Oman, most of the global oil production comes from mature or maturing fields with an average recovery factor of around 30 to 35 percent. Since 50 to 70 percent of the oil hasn't been recovered, maturing oil reservoirs possess enormous potential. In previous years, production through the three main EOR methods, thermal recovery, gas injection, and chemical injection, was about 3 million barrels per day (b/d) or 3.5 percent of the world crude oil production per day (Gregory, Omom, and Greil 2014: 16). Of these 3 million b/d, 66 percent were produced through thermal recovery (Kokal and Al-Kaabi 2010: 1). In general, the process of recovering oil is broken down into three different phases: primary, secondary, and tertiary recovery. Source: Gregory, Omom, and Greil 2014: 14 Primary and secondary recovery are considered conventional recovery and target the mobile oil in the reservoir, whereas tertiary recovery targets immobile oil which cannot be recovered due to capillary and vicious forces. Tertiary oil recovery, referred to as EOR, relates to the injection of gases, steam, oxygen, air, polymer solutions, gels, surfactant-polymer-formations, alkaline-surfactant-polymer formations, or microorganism formations into the reservoir, as these fluids reduce the viscosity and thereby enhance the flow of oil (Gregory, Omom, and Greil 2014: 14). While steam injection is the preferred EOR method, especially for heavy crude[1] with a high viscosity, there are different ways of how to produce the necessary steam. In the conventional steam injection method, natural gas is burned to produce steam from boiling water. The Concentrating Solar Power (CSP) technology merely replaces natural gas with solar power. Petroleum Development Oman (PDO)[2], the major exploration company in the Sultanate, was fighting declining oil output from its maturing reservoirs with the enhanced usage of steam injection produced with natural gas. However, it became gradually more difficult for the country to satisfy the growing domestic demand, driven by the need for gas in generating power and the development of other industries (Sergie and Dipaola 2015). To limit the quantity of imported gas, the Omani government together with its partners, Shell and Total, decided to invest $600 million in the construction of the Miraah - Arabic for a mirror - solar power plant. Located at the Amal West oil field in the southern part of Oman, the 1,021 MW solar-thermal facility could save up to 5.6 trillion btu, enough to provide 209 000 Omanis, 5 percent of the country’s population, with electricity (Kantchev 2015; Kramer 2017). Steam generated from the CSP technology has the same quality and temperature as the one generated from gas and resembles a perfect substitute. The solar technology used at the Miraah power plant does not use solar panels but large, curved mirrors which automatically track the sun throughout the day, concentrate the sunlight on a pipe filled with water, bring it to boil, and thereby produce high-pressure steam. Upon the successful completion of a 7-MW pilot project in 2013, the company GlassPoint started construction on the Miraah plant in 2015 (Renewable Now 2017). The American company pioneered an enclosed trough system which is particularly suited to transport the CSP technology from the arid region of southern California to the desert environment of the Arabian Peninsula. Setting up the solar mirrors inside a greenhouse results in three major advantages: reducing costs, achieving high energy density, and protecting sensitive technology. To avoid soaring custom project costs, GlassPoint builds its solar fields in glasshouse blocks using a series of standardized steps, where the majority of the system is comprised of prefabricated components that can be easily assembled onsite. Routinized constructions steps not only improve the speed of deployment, but by doing so also drive down the costs of construction. This point was validated on November 1st, 2017, when PDO and GlassPoint announced that the first out of 36 blocks that constitute the solar plant was completed on time and on budget (PDO 2017). Standardized construction measures as well as the availability to fall back on lower-cost material thanks to the protection offered by the glasshouse, drastically decreases the production costs. Furthermore, the straight surface of the greenhouse positively affects operating costs as it allows for easy cleaning by a robotic system, compared to a slightly more complicated cleaning process for the curved mirrors. Source: Operating CSP in Desert Conditions, Glasspoint The second advantage of the enclosed troughs is that the glasshouse blocks provide high energy density as 93 percent of the land area can be covered with mirrors. Since the materials used in an enclosed trough can be low-cost, it is more cost-efficient to pack the collectors tightly together into a smaller space (GlassPoint 2017: Standard Block). The additional energy generated during peak sun hours, when the sun is high in the sky, far exceed any losses from shading caused by neighboring mirrors during the low sun hours. Achieving high energy density is crucial for EOR applications because steam needs to be produced close to the oil field so that it travels the shortest distance. Without the protection offered by the glasshouse, sand and dust storms, common phenomena in the deserts of the Middle East, would decrease the efficiency of the mirrors through soiling. Because the glasshouse has a height of 6 meters above the ground, soiling rates are 50 percent less compared to objects that are merely 1 meter above the ground (GlassPoint 2017: Sealed from Dust). The glasshouse also prevents damages to the mirrors and other delicate components of the system caused by sand, wind, and humidity. The Miraah solar plant could produce up to 80 percent of the steam that is needed for the EOR (Power Technology). This would allow Oman to free up natural gas currently utilized for EOR and use it in other parts of its economy. Furthermore, substituting natural gas with solar steam would remove the largest and most volatile cost of thermal EOR: the price of gas. Even though a certain amount of gas would still be required to maintain steam injection at night, CSP has the potential to drive down the quantity of natural gas needed in producing steam. With a stabilized oil price in the range of $55 to $65 and an increasing demand for the use of natural gas in other parts the economy, the capital-intensive investment needed for CSP is becoming more attractive. Yet, the spread of the technology will also depend on the success of and insights from the Miraah power plant. As GlassPoint continues construction on time and on budget, national and international oil companies trying to increase the recovery rate of maturing fields might consider substituting natural gas for solar energy. [1] The viscosity resembles a particular attribute that defines the quality of crude oil and is expressed in API (American Petroleum Institute) gravity. An API of 40 and higher resembles low viscosity and stands for high-quality crude oil. Due to its increased mobility (fluidity), reservoirs containing light crude reach a higher recovery factor at a lower average cost, while at the same time light crude reaches higher prices on the world market as it requires a lower quantity of energy during the refinement process. Heavy crude on the other side, with an API below 20, is very thick and therefore immobile. Contrary to light crude, recovery costs for heavy crude are higher and the prices exporters obtain on the world market significantly lower as more energy is required for refinement. Thermal EOR methods for heavy crude become economically justifiable once the oil price reaches a certain level. [2] Owned to 60 percent by the Omani government, 34 percent Shell, 4 percent Total, and 2 percent PATEX. Kevin Matthees, Senior Analyst at Infomineo. References GlassPoint. 2017. “Sealed from dust.” Technology. https://www.glasspoint.com/technology/sealed-from-dust/. ---. 2017. “Standard Block.” Technology. https://www.glasspoint.com/technology/standard-block/. Gregory, Mark, David Omom, and Pierre-Alexandre Greil. 2014. “Solar Enhanced oil recovery. An in-country value assessment for Oman.” Ernst&Young. January. http://www.ey.com/Publication/vwLUAssets/EY-Solar-enhanced-oil-recovery-in-Oman-January-2014/$FILE/EY-Solar-enhanced-oil-recovery-in-Oman-January-2014.pdf. Kantchev, Georgi. 2015. “Oman to Build Giant Solar Plant to Extract Oil” Washington Post, 8 July. Kokal, Sunil and Abdulaziz Al-Kaabi. 2010. “Enhanced oil recovery: challenges and opportunities.” EXPEC Advanced Research Centre. Saudi Aramco. http://www.world-petroleum.org/docs/docs/publications/2010yearbook/P64-69_Kokal-Al_Kaabi.pdf. Kramer, Susan. 2017. “Solar EOR a Big Win for GlassPoint.” SolarPACES. July 3. http://www.solarpaces.org/glasspoint-solar-eor-miraah-start-august/. Petroleum Development Oman. 2017. “Miraah Solar Plant Delivers First Steam to Amal West Oilfield.” Press Release. November 1. http://www.pdo.co.om/en/news/press-releases/Pages/Miraah%20Solar%20Plant%20Delivers%20First%20Steam%20to%20Amal%20West%20Oilfield.aspx. Power Technology. Unknown. “Mirah Solar Thermal Project.” http://www.power-technology.com/projects/miraah-solar-thermal-project/. Renewables Now. 2017. “Miraah solar thermal plantin Oman delivers 1st steam for EOR.” November1. https://renewablesnow.com/news/miraah-solar-thermal-plant-in-oman-delivers-1st-steam-for-eor-589407/. Sergie, Mohammed, and Anthony Dipaola. 2015. “Oman said to consider LNG imports as domestic gas use surges.” Bloomberg. August 30. https://www.bloomberg.com/news/articles/2015-08-30/oman-said-to-consider-importing-lng-as-domestic-gas-use-surges. https://www.glasspoint.com/technology/integration/ https://www.glasspoint.com/technology/sealed-from-dust/

Aggregate data shows that the African continent remains one of the fastest-growing economies worldwide. However, many African countries still base their economy on the production and exportation of commodities, primarily crude oil, with a few value-added operations developed internally. Oil is a natural resource that commonly attracts a high amount of foreign investment and boosts the main economic indicators of a country. It can be easily used as a proxy for natural resource based economies. Moreover, due to the current commodity crisis for certain economies, with the barrel price sinking in 2014-15 to its lowest level since 2003[1], it is easier to highlight some differences in performance between oil producing and non-oil producing African countries. It is also important to highlight such differences since it provides an opportunity to assess the convenience and sustainability of a development process based on these natural resources. Oil and Non-oil Producing Countries Nineteen of the 54 African countries are currently oil producers, however, it is worth noting the number of produced barrels can considerably vary from one country to another. Those countries are home to about 56% of the African population.[2] Fig.1 - African crude oil producing countries[3] In terms of wealth, the gap between the two groups of countries is evident, when it comes to GDP and GDP per capita. Nevertheless, the growth rates for both indicators show how the recent trends are not necessarily related to the oil economy. In relative values, the non-producing countries show better performance than the producers, but the progress of the two groups of countries can be reasonably compared over the years. Fig. 2 – GDP in USD bln[4] Fig. 3 – GDP growth[5] Fig. 4 – GDP per capita in USD[6] Fig. 5 – GDP per capita growth[7] It is easy to identify the higher impact that the 2014-15 price crisis had on oil-producing countries, whose overall GDP and GDP per capita fell by 10.0% and 12.2% respectively in 2015. The same crisis could have also been an important factor in the good export dynamics. As the following chart shows, the oil-producing countries’ export precipitated in 2015 (-49.0%), as a result of a negative trend during the last five years. Even the export from non-oil producing countries fell during the same period, but the overall decrease is moderate (-2.0%). Fig. 6 – Export of goods in USD bln[8] Fig. 7 – Export of goods growth (decrease)[9] In terms of attractiveness, the oil economies continue to attract the most attention from foreign investors, despite the fall in oil prices. The producing countries received increasing FDI (+4,7%) with a fluctuating trend in the course of the years. In the last years, the oil-free countries received around 21% to 56% fewer inflows compared to the oil producers, yet still showing an overall +1.0% growth. Fig. 8 – FDI inflows in USD bln[10] Fig. 9 – FDI inflows growth[11] Beyond indicators strictly related to the economy, it is interesting to recognise how the richer oil-producing countries are on average more developed than the others. With reference to human development aspects such as life expectancy, education, and income per capita (enclosed in the elaboration of the Human Development Index), the African oil producing countries show better performance than non-producers. The following chart shows this gap, despite the fact that HDI growth trends are comparable among the two groups of countries. Fig. 10 – Human Development Index[12] Consequences and Recommendations The recent crash in oil markets and commodity prices has harshly affected the global economy, with no immunity offered to developing countries. Saudi Arabia for instance, once thought immune to the downturn in oil prices, was recently declared at the verge of bankruptcy and forced to make its first international bond sale[13] to bring in necessary cash. In Nigeria, the falling oil prices have been claimed to have “a painful effect” on the country’s economy, with the necessary slowdown of the production and a negative impact on the rest of the industry[14]. In Angola, the oil crisis is believed to have unmasked how poorly managed the country really was in the last decade, giving visibility to all the economic and social deficiencies that were concealed by the high growth percentages[15]. Even some non-producing countries have been affected by the negative situation. For example, in Mozambique the realisation of various large projects aiming to benefit from the country’s natural gas resources, whose selling price is strictly related to oil price, has been continuously delayed these past years. This conjuncture created a series of erroneous expectations leading the country into a major economic downturn, with the government taking on more debt assuming an easy repayment, once revenue from LNG started flowing[16]. The IMF pointed out how most of the African countries where energy and mining exports accounted for a larger share of GDP will need to make “sizeable adjustments” to their domestic spending. On the other hand, countries that have invested in infrastructure and strengthened domestic consumption are all expected to grow at rates between 6-7% and more in the next few years. This is the case for the Ivory Coast, Kenya, Rwanda, Senegal and Tanzania[17], leading to the clear but not so obvious conclusion that diversification is an inescapable factor for sustainable growth. Antonio Pilogallo, Associate at Infomineo. Learn more about Antonio. [1] Source: http://www.bbc.com/news/world-35345874. [2] Source: Infomineo analysis on WB data [3] Source: https://www.cia.gov/library/publications/the-world-factbook/rankorder/2241rank.html. Given the very small amount of crude oil production, Morocco has been considered as a non-producing country. [4] Source: Infomineo analysis on WB data [5] Source: Infomineo analysis on WB data [6] Source: Infomineo analysis on WB data [7] Source: Infomineo analysis on WB data [8] Source: Infomineo analysis on UN Comtrade data [9] Source: Infomineo analysis on UN Comtrade data [10] Source: Infomineo analysis on UNCTAD data [11] Source: Infomineo analysis on UNCTAD data [12] Source: Infomineo analysis on UNDP data [13]Source: http://www.forbes.com/sites/timdaiss/2016/10/23/we-are-doomed-to-bankruptcy-unless-changes-made-says-saudi-official/#6e9b68d24471 [14] Source: http://www.bbc.com/news/world-35345874 [15] Source: https://www.washingtonpost.com/news/worldviews/wp/2016/08/02/how-the-crash-in-oil-prices-devastated-angola-and-venezuela/?utm_term=.816db1e8ab7d [16] Source: http://ww2.frost.com/frost-perspectives/impact-oil-and-gas-price-slump-mozambiques-economy/ [17] Source: https://www.weforum.org/agenda/2016/04/10-things-the-imf-wants-you-to-know-about-africas-economy
For years, energy has been heavily subsidized in the MENA region. As stated by the IMF, in 2011 energy subsidies represented 8.5 % of GDP and 22 % of government revenue, at a total cost of $240 billion. Moreover, “six of the world’s largest subsidizing countries are found in MENA, led by Kuwait, Iran, Saudi Arabia, and Qatar, where residents pay less than a third of international prices for fuel and electricity” [1]. For instance, to subsidise electricity and water in Abu Dhabi in 2014, the government spent DH17.5 billion. Also, in the summer of 2014, the Saudi Arabian government burnt 900,000 barrels of oil a month to meet the demand of the already subsidized electricity [2]. This situation was made possible by reserves representing about 57 % of the world’s proven oil reserves and 41 % of proven natural gas resources.[3] (more…)

Africa has for some time now become the focus of the international economic community. With growth having stalled in much of the world’s continents for the last few years, Africa has naturally seen its development take centre stage. Its growing sectors have been more and more sought after for investment opportunities – one of which is the extractives industry. (more…)

From oil and gas to diamonds and other minerals, Angola is extremely rich in natural resources and its economy is deeply influenced by them. Proof of this is that 42.39% of the country’s GDP (Gross Domestic Product) in 2013 was due to Oil and Diamonds alone. On the other hand, Angola is listed as a Low Human Development Country and it is estimated that over 54% of its population lives on less than 2 USD a day. Having said that, this article attempts a short journey at some of the Angolan natural resources to understand if their economic impact can be translated into social development. (more…)
The African continent is often considered as a place of great opportunities for mining resources. But, figures show a different reality: the African continent accounts for 5.5% of the world total production in 2011[1], behind Asia (58.2%), Northern Americas (14.5%), Europe (9.9%) and Southern Americas (7.0%) and close to Australia (4.9%). This apparent contradiction is explained by the fact that, despite the relative small weight of Africa in the World mining production, Africa is the leading region of production for specific minerals, often highly valuated. (more…)